



Interpretable abstractions of artificial neural networks predict behavior and neural activity during human information gathering
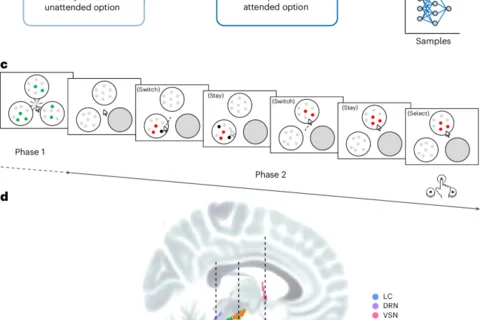
Main Decisions should be based on evidence. Once sufficient evidence has been sampled, the agent can decide which option to select (Fig. 1a , top). But in addition to guiding the choice, evidence should also simultaneously be used to evaluate whether there is sufficient information to warrant a decision or whether further information must be sampled (Fig. 1a , bottom) 1 , 2 , 3 , 4 . When sampling information, attentional constraints mean that decision-makers typically focus on only one option at a time 5 . There is therefore a further decision as to whether more evidence should be gathered from the currently attended option or whether attention should be shifted to an alternative (Fig. 1a , bottom). Gathering more information can improve decision quality; however, it also comes at the expense of time, energy and lost opportunities to engage in other activities. An extreme illustration is the fourteenth-century thought experiment of Buridan’s ass (Fig. 1a ) 6 : unable to choose between two equal piles of hay, the ass starves. Although several studies have shed light on the computational and neural mechanisms underlying value learning and option selection 7 , 8 , the factors that determine when to stop gathering information and commit to a final decision, as well as which options to sample from, remain an active area of investigation 1 , 4 , 9 , 10 , 11 . Fig. 1: Information-sampling task. a , The decision-making process involves two key decisions: whether to gather more information or make a selection (top versus bottom) and, if gathering information, whether to sample from the currently attended option or switch to the alternative (top right versus top left). b , Three approaches to computing the VoI as a function of the number of samples. Top: a linear function where value decreases at a constant rate with each additional sample. Middle: UCB algorithm that captures diminishing returns, with steeper initial decline that flattens as samples accumulate. Bottom: an ANN that learns the mapping between samples and information value; the learned function’s form is not specified a priori. c , Task structure showing the two phases of the information-sampling task. In phase 1, participants are presented with three patches of dots covered by green or gray covers. After revealing the green-covered dots in each patch, one patch is blocked (gray circle). In phase 2, participants can freely sample information by hovering over patches, with gray-covered dots revealing their true colors sequentially, before making a final selection. When participants switched patches, previously revealed dots in the unattended patch returned to their gray-covered state, requiring reliance on memory (as illustrated by the gray patch in phase 2, right panel). d , Brain ROIs: LC, DRN, VSN, SN and VTA, which have been implicated in uncertainty processing and information sampling. A standard approach in cognitive neuroscience is to formalize hypotheses about cognitive computations as mathematical models that generate quantitative predictions for behavior and neural activity. Two such hypotheses can be considered for how individuals guide their information sampling. The first posits that people compute the value of gathering additional information as a linear function of an option’s uncertainty (for example, the amount of missing knowledge; Fig. 1b , top) 12 , 13 , 14 . This approach would prioritize further sampling from more uncertain options. However, theories of sequential sampling processes and Bayesian updating indicate that repeatedly sampling from the same option yields diminishing returns (Fig. 1b , middle), motivating a second hypothesis: that the value of information (VoI) is computed using a nonlinear function of uncertainty 1 , 9 . The upper confidence bound (UCB) algorithm, a widely used exploration heuristic that captures this nonlinear relation, can formalize this hypothesis. Both linear and UCB models aim to characterize the functional form of a cognitive computation, such as the value of sampling, in a psychologically interpretable way. Although the concept of diminishing returns helps narrow down the space of hypotheses, there is still a wide range of nonlinear functions that could describe how people value information. This presents a challenge in psychology and neuroscience, where it is often difficult to select a specific instantiation of a general principle, slowing the pace of new discoveries. An alternative approach is to use machine learning to provide a more flexible, data-driven model of participants’ choices: for example, using artificial neural networks (ANNs) to fit behavior. ANNs can learn complex mappings from data, vastly expanding the space of candidate functions that can be considered (Fig. 1b , bottom) 15 , 16 . The universal function approximation theorem underpins this method, asserting that sufficiently deep neural networks can model any continuous function to arbitrary precision, given sufficient training data. This capability allows us to learn directly from data how individuals might compute the VoI to guide their behavior, without needing to specify the exact form of the function in advance. By comparing an ANN’s performance against established, fixed-form functions (like linear or UCB), we can directly assess whether these more constrained models adequately capture the complexities of information valuation. ANNs can thus be used as a tool to discover a potentially more accurate functional description of how people assign value to information. However, this expressive power comes at a cost. Although ANNs may yield more accurate predictions, they typically lack interpretability. The learned representations are distributed, high-dimensional and opaque, making it difficult to extract mechanistic or symbolic insights about underlying cognitive processes. Here we propose a modeling approach that yields expressive yet interpretable models of choice. First, we integrate data-driven and knowledge-driven components into a hybrid model of subjects’ information-sampling and decision-making behavior 15 . The knowledge-driven component incorporates established cognitive principles, such as the mechanisms underlying option selection 8 , 17 . The data-driven component utilizes ANNs to model aspects of cognition that are difficult to define, such as complex information-sampling strategies. This hybrid is more expressive than a fully knowledge-driven model and more interpretable than a fully data-driven one. Second, we apply symbolic regression 18 , 19 to the trained ANN to recover a compact, four-parameter approximation of its learned function, providing a new route to theory generation from data. We show that the recovered function reveals an information-symmetry principle (participants value sampling based on the relative evidence accumulated across options rather than option-wise uncertainty) and generalizes to an entirely separate experimental dataset on human information sampling 20 . We used our approach to model human behavioral data from a task designed to assess evaluation of information and choice selection (Fig. 1c ). Several brain regions are thought to play key roles in information sampling under uncertainty. Notably, all the neuromodulatory systems with their origins in the ventral tegmental area (VTA), substantia nigra (SN), dorsal raphe nucleus (DRN), locus coeruleus (LC) and ventral septal nucleus (VSN) have at one time or another been proposed to reflect uncertainty or the potential for information gain 3 , 21 , 22 , 23 , 24 , 25 , 26 , 27 (Fig. 1d ). It is less clear whether each neuromodulatory system has a specific or unique relationship with uncertainty. Recording simultaneously from multiple nuclei has been difficult in animal models, and conventional human neuroimaging lacks the spatial resolution to reliably isolate their signals. Here we exploit high-resolution (1-mm isotropic), rapid-repetition-time (1.378 s), accelerated ultrahigh-field (7T) functional magnetic resonance imaging (fMRI) 27 , 28 to measure activity simultaneously across all five neuromodulatory nuclei and two interconnected cortical regions that project to them: the anterior insula (AI) and anterior cingulate cortex (ACC) 3 , 22 , 29 , 30 , 31 , 32 , 33 . Guided by the hybrid-ANN model, we identified distinct patterns across these seven regions: VTA activity arbitrated between information gathering and choice, and ACC and AI tracked VoI signals that guided sampling behavior. Results Sampling behavior adaptively scales with task difficulty and uncertainty Twenty participants completed an information-sampling task (Fig. 1c ) inside a 7T MRI scanner. In each trial, they were presented with two patches of 100 moving dots. Participants were informed that the true color of each dot was either red or black, and the goal was to select the patch with the highest number of red dots. At the start of each trial, however, the true color of the dots in each patch was unknown because they were hidden under green or gray covers. The number of green dot covers (revealed simultaneously upon first hover) varied from 5 to 30, and the number of gray dot covers (revealed sequentially) correspondingly ranged from 70 to 95. Participants used a trackball to hover over a patch, and this led to the true color (red or black) being gradually revealed. Upon hovering, participants had to wait 2 s before any new information appeared. After the waiting period, the green dot covers were all removed to reveal which dots were either red or black. The gray covers of individual dots were then also removed, but they were removed one by one every 150 ms, again revealing either a red or black dot. Each patch, therefore, provided a different amount of initial information on sampling, indicated by green dots, which varied between trials. For instance, if a patch had 20 green dots, the color of these dots would be revealed as red or black during the first sample of the first visit to that patch. The gray dots in the patch were then revealed as either red or black one by one. By manipulating the amount of initial information gain, this design allowed us to separate the time spent in a patch from the uncertainty about the number of red dots in that patch. This design also allowed us to examine how background uncertainty, as well as the uncertainty of the options themselves, affects sampling behavior. By signaling the initial amount of information with green dots, participants could estimate the starting uncertainty of each option. Once all green dots were shown, one of the three options was blocked, leaving only two options available. The blocked option’s uncertainty (background uncertainty) was unaffected by participants’ actions and did not impact the task of selecting the patch with more red dots. Each participant completed four sessions, each of which lasted 25 min. Participants were instructed and incentivized to make as many correct choices as possible in each session. Notably, because each session had a fixed duration, spending excessive time revealing all dots in a single trial reduced the number of subsequent trials participants could attempt, thereby limiting their overall potential rewards. Participants exhibited varying preferences for speed versus accuracy in their sampling behavior (Fig. 2a ). Some participants opted to spend more time gathering information, aiming to increase accuracy, whereas others prioritized faster decisions, accepting a higher risk of error (correlation between amount of information and accuracy: r = 0.74, t = 4.33, P = 4.00 × 10 −4 ). As noted, each trial differed in two key aspects: the initial uncertainty of each option, as indicated by the green dots, and the final difference in red dots between the patches, ranging from a difference of 30 (easy trials) to 10 (difficult trials). Participants tended to gather more samples when the initial uncertainty was higher (there were fewer green dots, which were uncovered at the beginning of the sampling period, and more gray dots, which were uncovered only one by one during sampling: β = −0.069, standard error ( s . e .) = 0.013, z = −5.18, P = 2.27 × 10 −7 ) and when the final discrepancy in red dots was smaller ( β = −0.131, s . e . = 0.019, z = −6.87, P = 6.48 × 10 −12 ; Fig. 2b ). To assess whether this pattern is adaptive, we estimated an optimal policy for this task, given specific assumptions about sampling costs ( Methods ), solving the Bellman equation using dynamic programming 34 , 35 . We simulated action sequences from this optimal agent and compared them to the actual action sequences exhibited by participants. We found that participants’ sampling behavior qualitatively resembled the optimal policy derived from our computational analysis: they adaptively increased their sampling time when initial uncertainty (100 − number of green dots) was higher or when decisions were more challenging (lower disparity between the number of red dots associated with each option). Some participants deviated from this policy by sampling more information than was optimal; although their accuracy generally increased, they tended ultimately to earn fewer points (Fig. 2a ) because the extra time spent per trial reduced the number of trials they could complete. Fig. 2: Sampling behavior and computational model. a , Relationship between accuracy and average amount of evidence collected. Each colored dot represents an individual participant, with color indicating their final score according to the color scale on the right. The dark green star marks the position of the optimal agent (optimal under the cost assumptions specified in Methods ). n = 20 participants. b , Number of samples collected under different task conditions. Left: bar graph showing the number of samples collected across three levels of relative unsigned proportion of red dots between patches (0.1, 0.2, 0.3). Right: bar graph showing the number of samples collected across three levels of initial information (30, 45, 60 green dots). Individual participant data points are shown as colored dots, and black stars indicate the model-derived optimal agent’s behavior. c , Schematic of the computational model. The model transforms objective magnitudes (number and color of dots in each patch) into subjective magnitudes through attentional discounting and memory decay functions. These subjective magnitudes are used to compute the value of selecting each patch (pink) and the value of sampling more information (blue), which together determine the final action. The dotted blue circle highlights the component that computes the VoI, which is implemented using a linear function, UCB algorithm or ANN. Source data Finally, we examined which kinds of uncertainty influenced participants’ sampling behavior. In our task design, participants knew the initial uncertainty (number of green dots) of the blocked option, which should be irrelevant for optimal sampling be
Source: Nature